Characterization of employment in the National Non-Financial Public Sector
The OPC analysis consists of a description as of April 30, 2019 of government employment in the jurisdictions and entities that make up the National Public Administration (APN), government-owned companies and other entities of the National Non-Financial Public Sector (SPNNF), excluding universities.
This is a universe of 449,797 positions, of which 385,189 belong to APN, 34,239 to Other Entities (non-business but financially autonomous public organizations) and 30,319 to the thirteen government-owned companies for which information is available. Eighty-nine percent are employed by the National Executive Branch. In addition, there are about twenty legal regimes and more than 120 specific scales with different levels of employment.
From a historical viewpoint, while between 2010 and 2015 a sustained growth of employment was identified (with an increase of more than 20% in that term); between 2016 and 2018 the overall trend has been downward, exhibiting a decrease of close to 8% in the National Executive Branch.
Eighty percent comprise the permanent staff, 26% have a university degree -predominantly positioned in decentralized agencies- and the employment is concentrated in two age groups: 20-34 years old and 35-49 years old, both being over 75% of the total.
The average gross general salary in this universe is AR$60,748, but most of the employment is below this level (64.2%). In fact, the median of the distribution is AR$48,463. Average salaries are higher in companies and decentralized organizations and contrary to the general level, the Foreign Service of the Nation, the Judiciary and Collective Labor Agreements have a high percentage of their staff with average salaries above AR$66,000.
There is an inverse effect between the level of employment and the average salary. Those regimes with a higher level of employment have average salaries below the general average and those with lower relative employment have salaries above the general average.
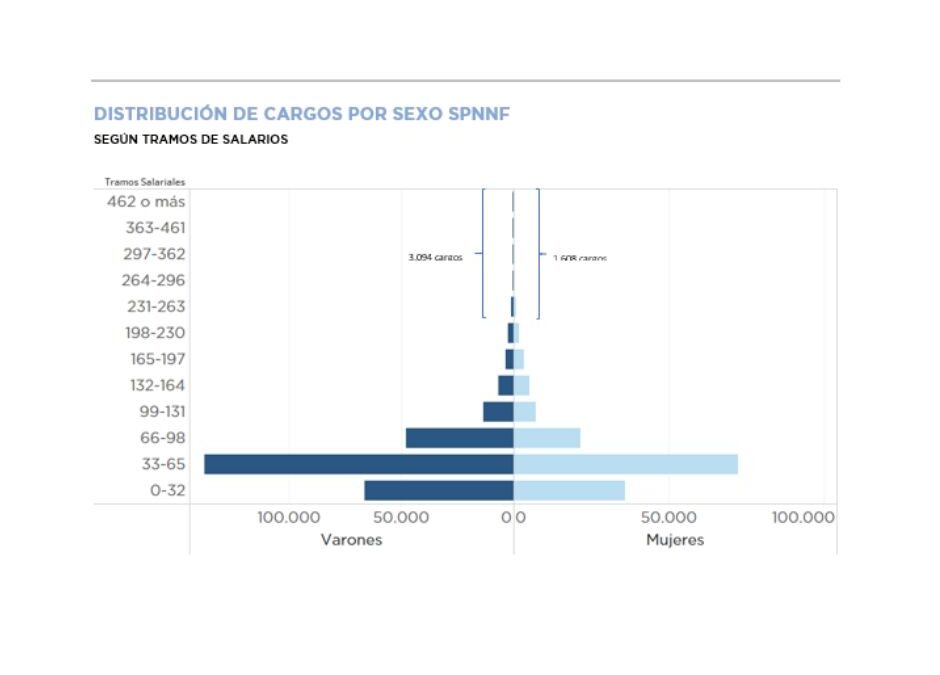
An analysis by sex shows that 35.0% of total employment are women and 65.0% are men, a proportion affected by the high relative weight of the armed and security forces. The average salary of women is lower than that of men at all levels of education and, in line with this bias, there is greater representation of men in the higher income segments.