Only 10% of the National Government expenditure has flexibility and can be reduced or reallocated. This proportion, over which the Government has the greatest margin of action, decreased in the last few years and currently the “fiscal space” -both in terms of expenditure and the allocation of resources in the budget- is very reduced.
- From 2010 to 2021, rigid expenditures, mainly composed of pensions, wages, interest on debt, family allowances, among others, accounted for about two thirds of total expenditure (66.9%).
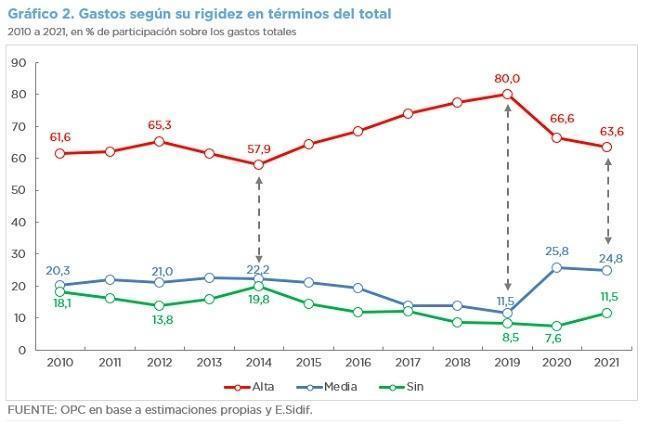
- This segment of rigid expenditure reached a maximum of 80.0% in 2019 and a minimum of 57.9% in 2014.
- The high rigidity expenditure component not only accounts for the largest share of total expenditure but has also been the most dynamic. It accounts for 84.0% of the growth recorded in the total National Government expenditure and between 2010 and 2010 its weight went from 19.8% to 25.5% of the Gross Domestic Product (GDP).
- In 2021, expenditures with high rigidity affected approximately 63.6% of total expenditure; those classified as medium rigidity accounted for 24.8% and the remainder (11.5%) are those expenditures that are more feasible to reallocate.
- Between 2010 and 2016, total expenditure grew 6.2 percentage points (p.p.) of GDP and, of this variation, 90% was explained by the growth of high rigidity expenditure.
- Between 2015 and 2019, there was a sustained increase in the share of high rigidity expenditure, reaching an annual average of 72.9% of the total, while the weight of non-rigid and medium rigidity expenditure fell to an annual average of 11.1% and 16.0%, respectively.
The existence of budget rigidities limits the ability of fiscal policy to react to unexpected or new scenarios.